KPI Report
This report shows the Key Performance Indicators of either the entire company or for specific teams. The purpose is to show Management and Developers how the traction is in the automation initiatives - how well we translate the efforts into actual measurable gains in the form of work time saved in the organisation.
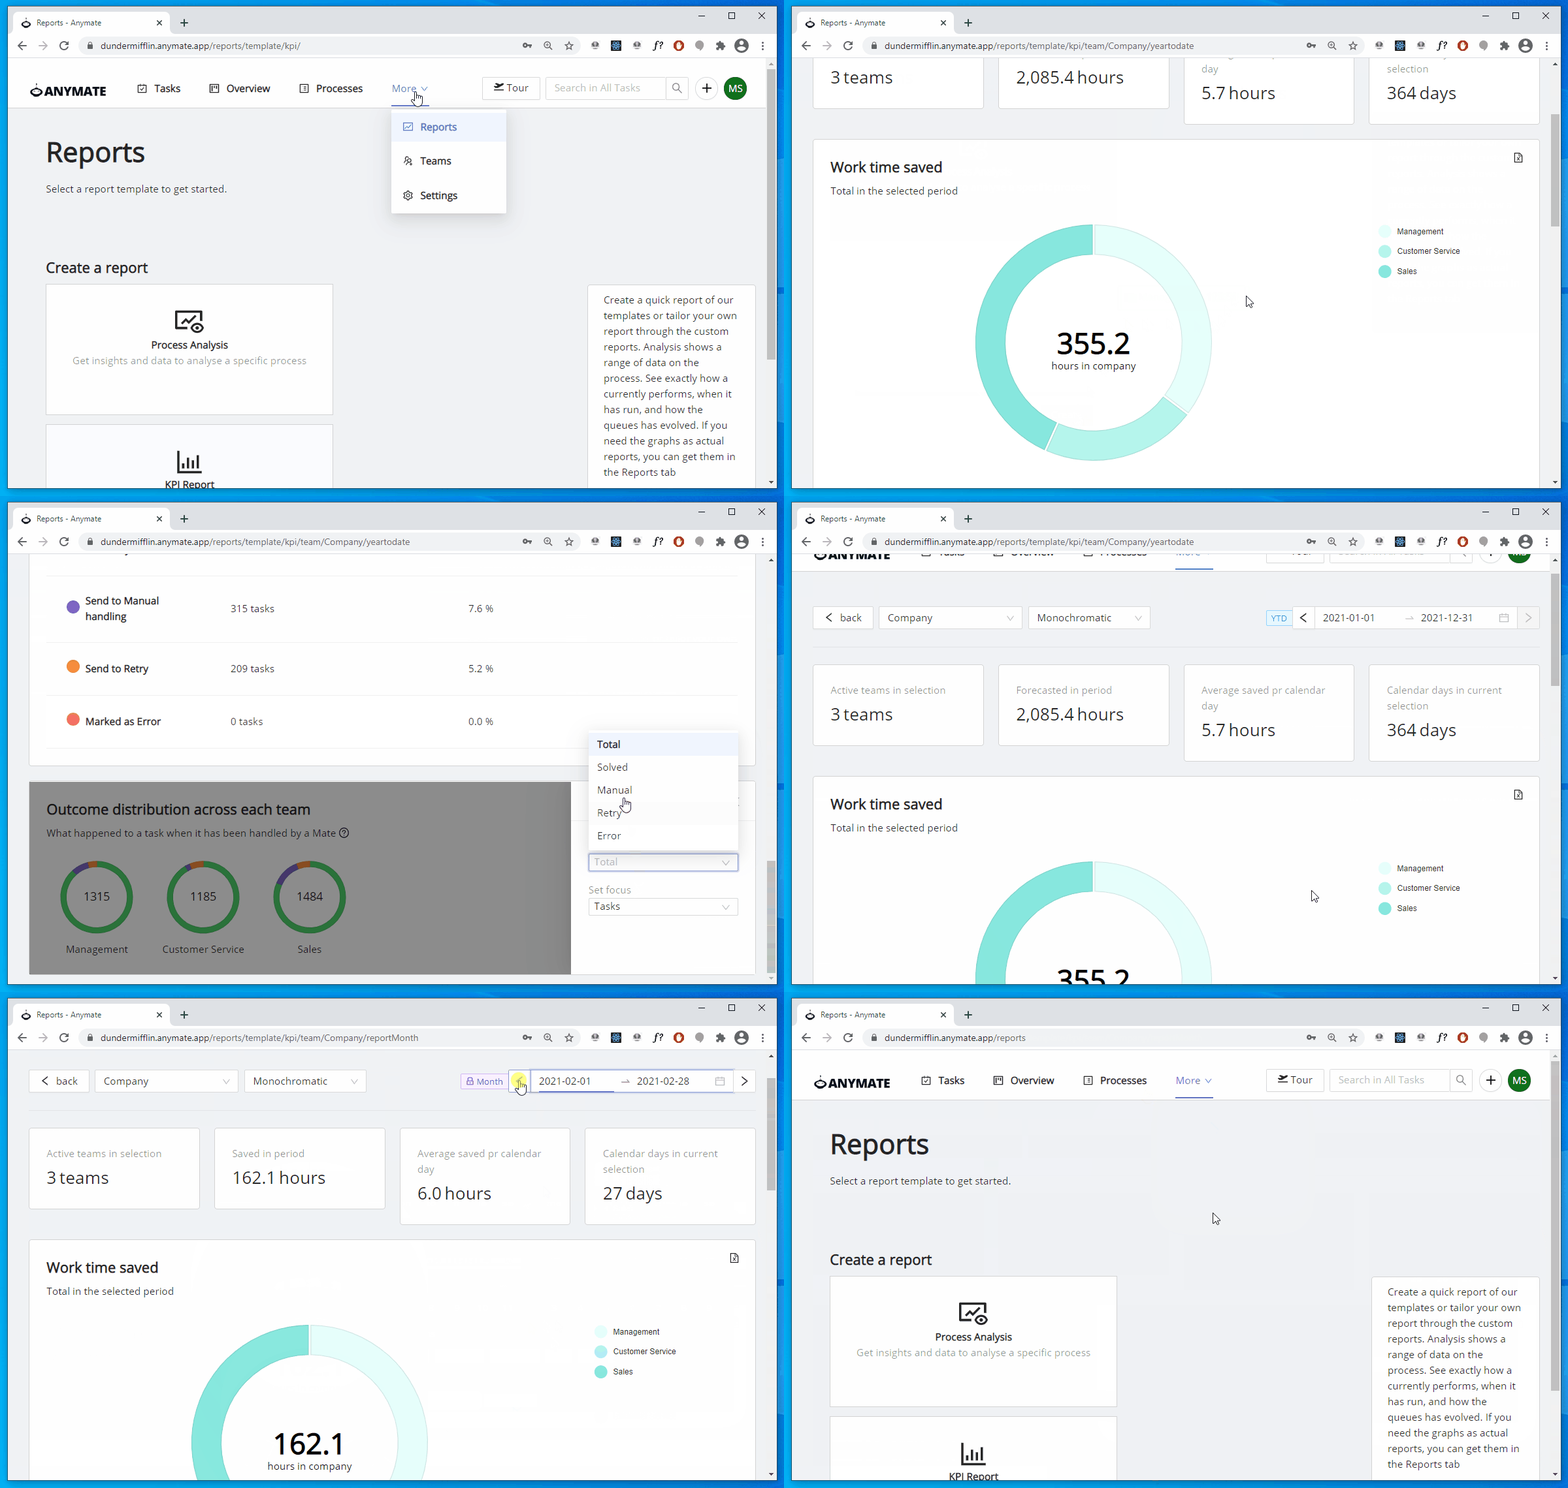
Creating the Report
Select the Reports tab in the top menu and select the KPI Report:
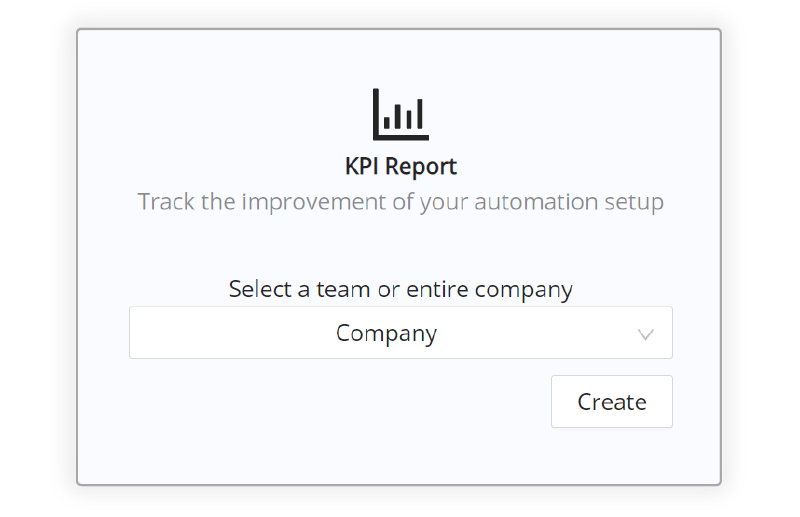
Choose either Company to get the view for all teams, or dive in to a specific team to see the view for all processes in that team.
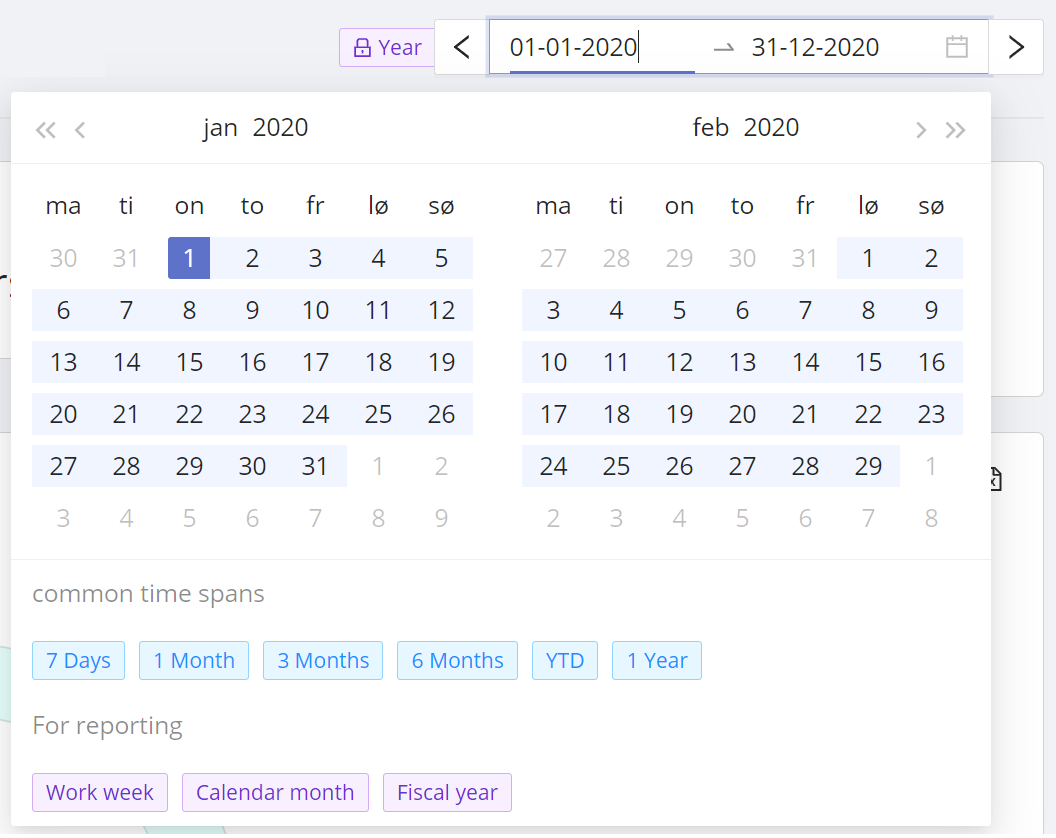
Changing time scope
You can choose a premade time scope or pick your own custom scope. The blue time spans are commonly used timespan throughout the entire app. The purple time spans are locked into standard units used for reporting, like a full month, or a full week
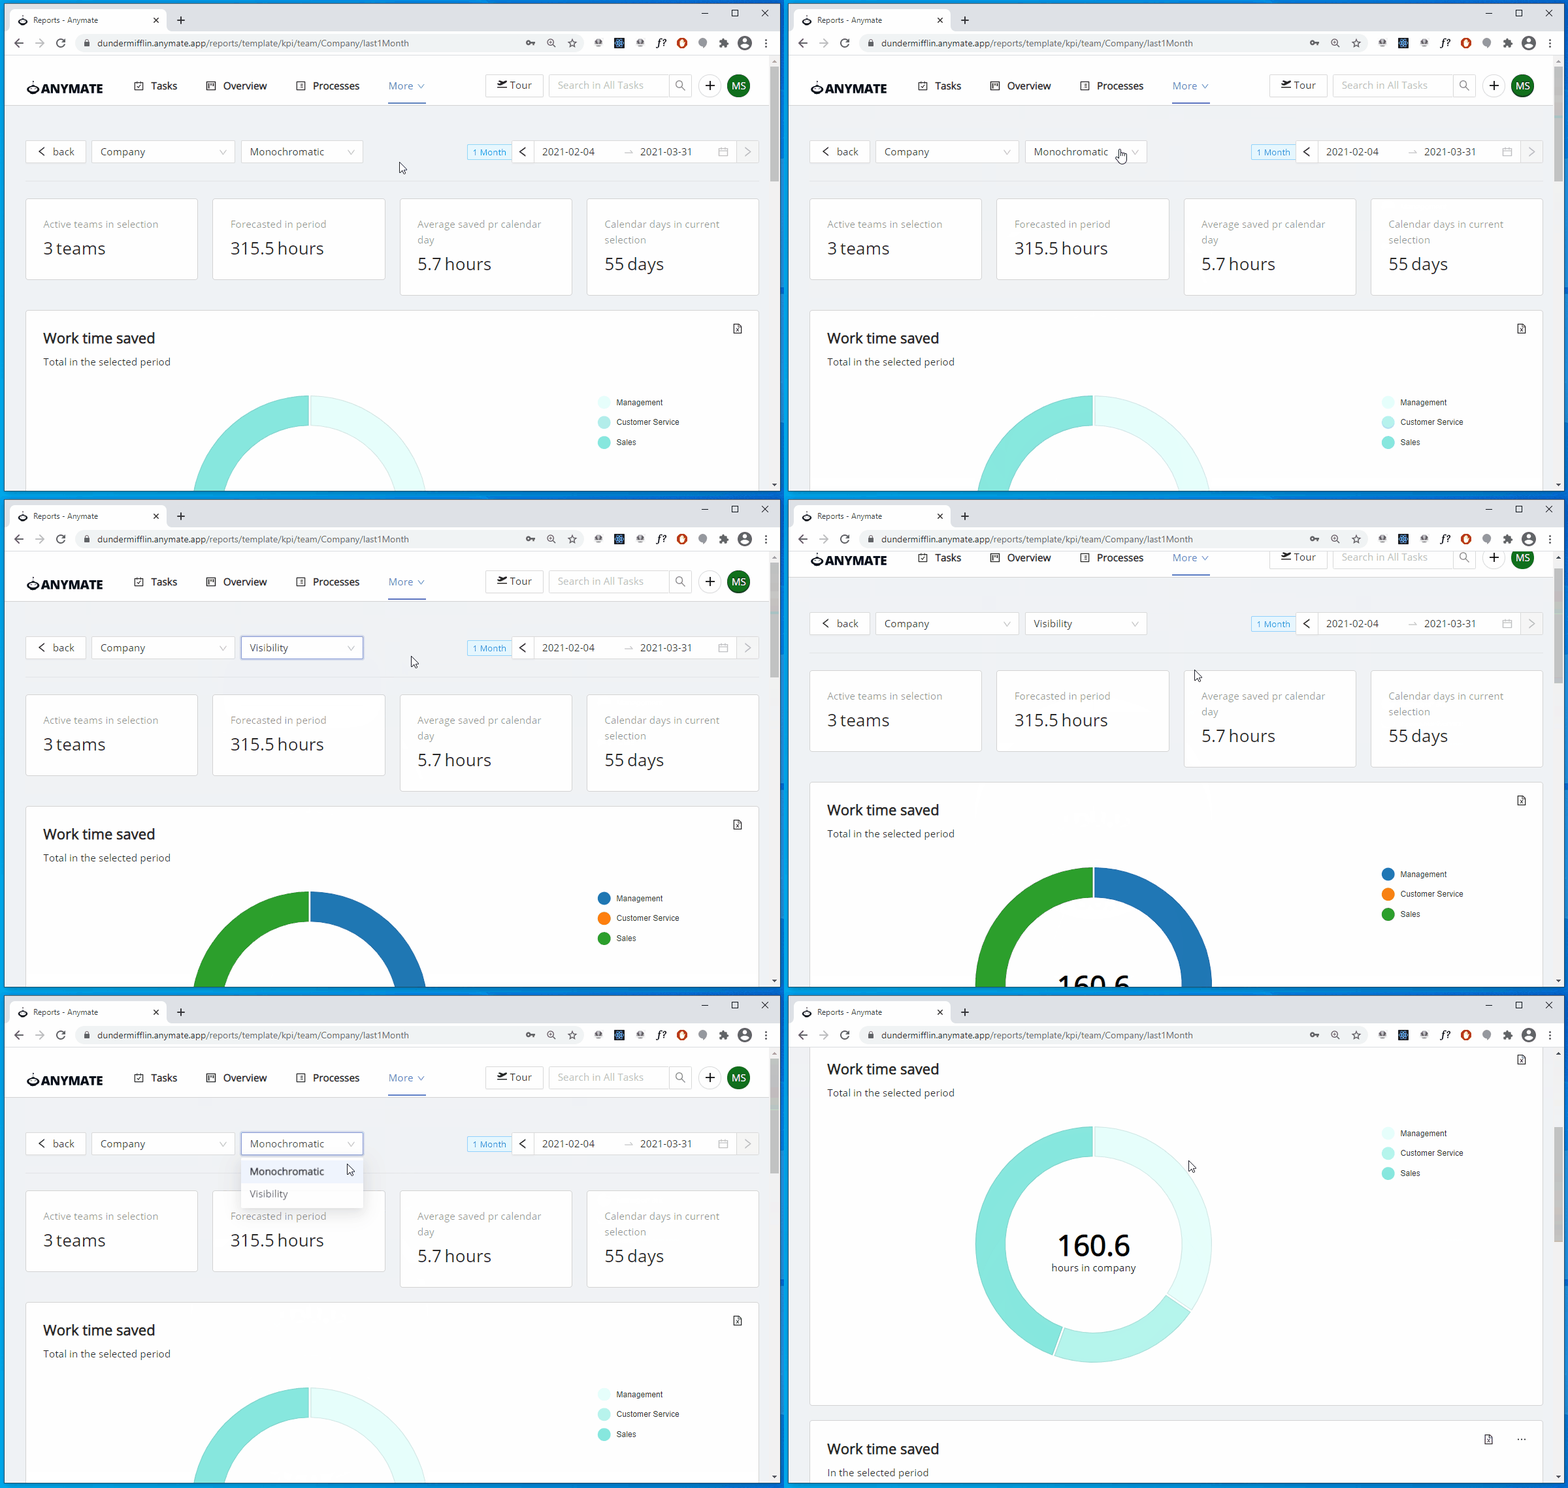
Change coloring
We built in a monochromatic style to and a style made for visibility. You can change it in the top of the report.
Sharing the report
The link in the URL can be used to share the main setup of the report:
- The scope (Company or a team)
- The selected predefined time scope
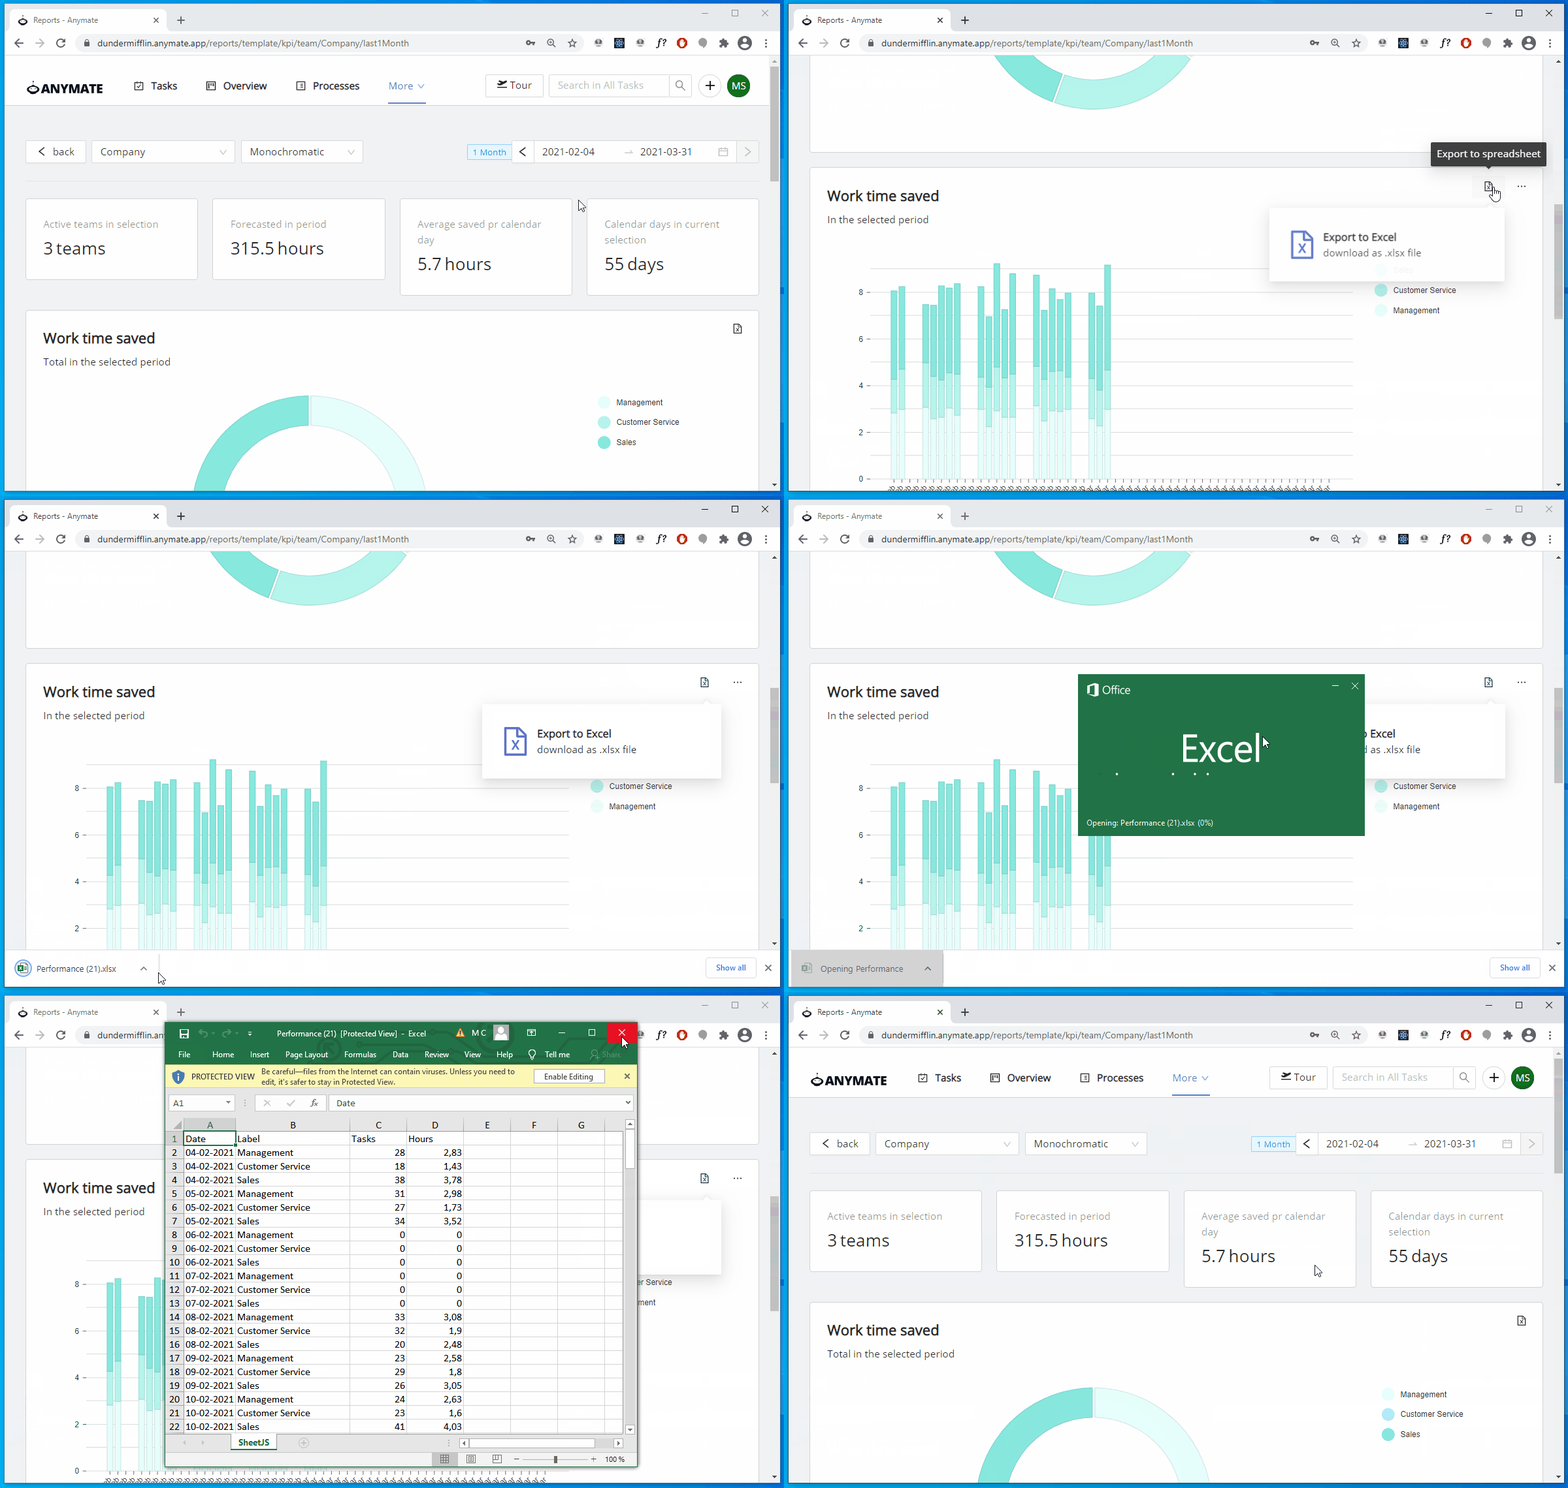
Exporting to spreadsheet
All graphs can be exported into spreadsheets using the Spreadsheet icon on the top right.
Analysis and Insights
Use the KPI report to follow up on business cases and prove traction. The most important indicators are Work time saved, Tasks done and stability. Check business cases with reality: did the promises deliver? Calculate the profitability of the overall automation initiatives. Use the work hours and the forecast to get an indication of how much the automation setup is going to help